Reports
Access and build reports on your data at any time with OneDesk’s comprehensive reporting & analytic features.
Powerful reporting
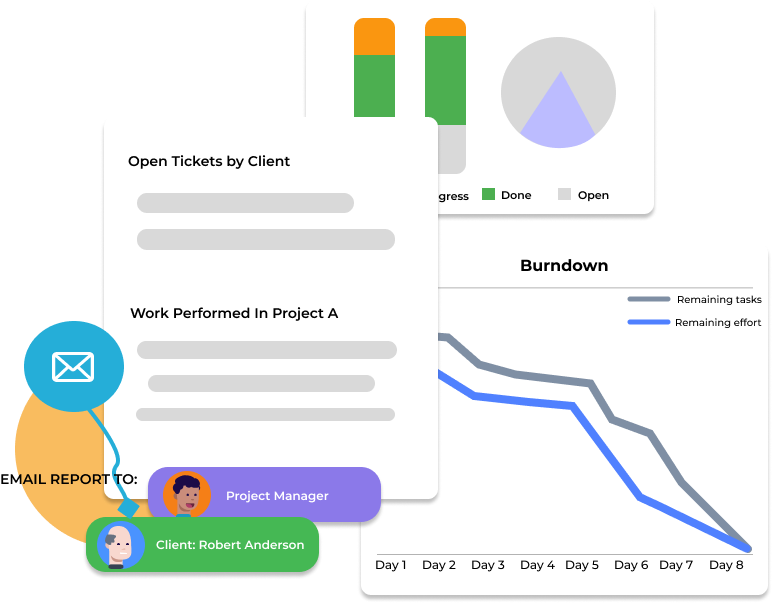
Create detailed reports on your tickets, tasks, projects, timesheets, and more! OneDesk comes with a number of pre-built reports as well as the ability to create completely custom reports. Run reports anytime, or schedule reports to send out automatically by email. You can choose the schedule as well as who to send the report to.
Custom reports
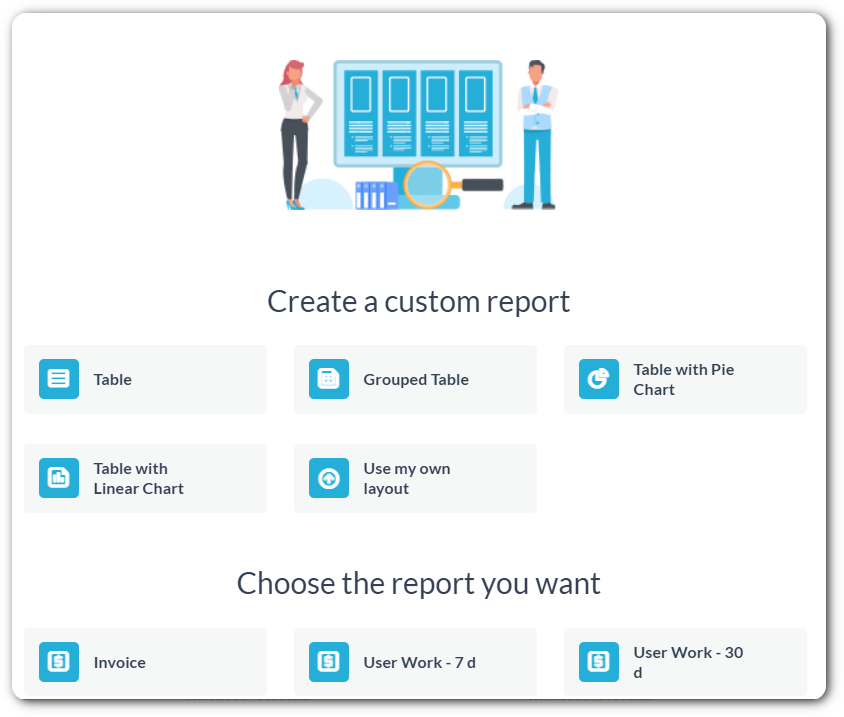
With the report wizard tool you can build the report you need by selecting the layout, properties, project, or filters of your choosing.
Export your data
OneDesk lets you export your custom work views. Choose filters, groupings, and columns then export with the click of a button. You can then perform your data analysis or provide detailed data to your customers.
Scheduled reports
Automatically schedule reports to be sent via email. You can send reports to managers, clients, colleagues, or yourself!
Analytics
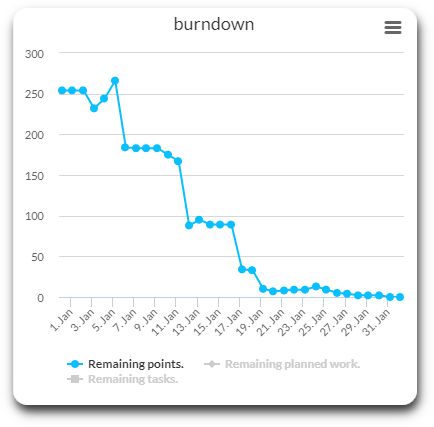
OneDesk provides a dashboard that displays useful charts detailing progress and status of tasks, tickets, and projects. Visualise the workload balance of your team and make better informed decisions. Charts can be filtered by project, team, date range, and more. You can also export charts for reporting purposes.
Analytics dashboard
OneDesk provides a dashboard that displays useful charts detailing progress and status of tasks, tickets, and projects. Charts can be filtered by project, team, date range, and more. You can also export charts for reporting purposes.
KPI widgets
OneDesk has chart widgets that aggregate your KPIs. These give you a quick glance at the current distribution of workload, status and schedule of your projects. You can also navigate or drill down to more details from the chart widget.
Activities log
Keep track of changes made to work with the comprehensive activity audit log. You can view activities for individual tickets, tasks, or projects or a detailed view of all activities.
More about reporting on the OneDesk blog
How to Create a Custom Chart Dashboard
The charts tab within the Analytics application allows you to analyze the efficiency of your customer support, and overall performance of your team and project ...
Read More →
How to Make Custom Reports in OneDesk – Examples
OneDesk’s reporting tool is a versatile way to present data relating to your business. There are many templates which exist by default in OneDesk, but ...
Read More →
Using the Report Creation Wizard
We have released an update to the report creation interface. This a big step forward for non-technical users to be able to generate and schedule ...
Read More →
How a Digital Creative Agency uses OneDesk for Ticketing & Reporting
Marketing products and services via internet-based media is arguably the most significant trend of the past few decades. This has grown from a mere idea ...
Read More →