- Velocity & Delivery Reporting
Quantify the Craft.
Master the Release Cycle.
Stop guessing your team’s capacity or struggling to explain where the time went. OneDesk delivers the metrics you need to optimize velocity, reduce cycle times, and ensure your team is spending their energy on high-impact product work.
Free 14-day trial · No credit card required
USE CASES
Master the Data Behind the Design
OneDesk transforms raw activity into actionable intelligence, ensuring your team ships faster and smarter every cycle.
Measure the Momentum Before You Miss the Milestone
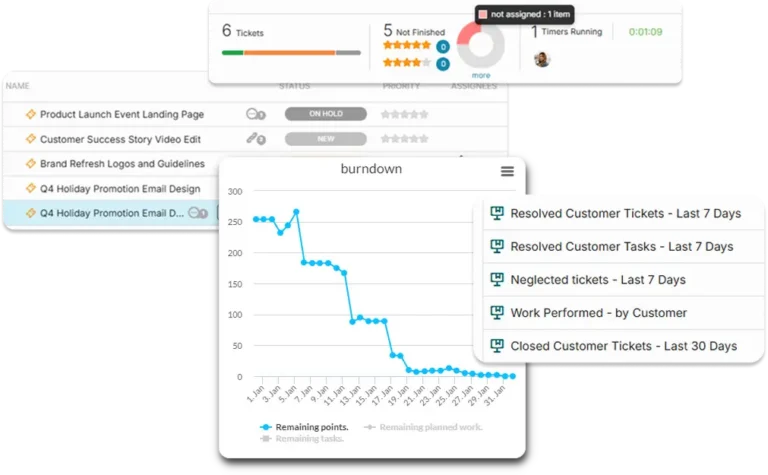
Understand the true speed of your development. OneDesk tracks lead times and cycle times across every project and portfolio, allowing you to see how long it takes for an idea to move from “Discovery” to “Deployed.” Identify the specific stages where work stalls so you can clear the path for high-velocity delivery.
- Monitor throughput across teams to set realistic roadmap expectations.
- Identify bottlenecks in your "Definition of Done" or QA processes.
- Visualize if your shipping frequency is increasing or plateauing over time.
Categorize the Effort Before You Calculate the ROI
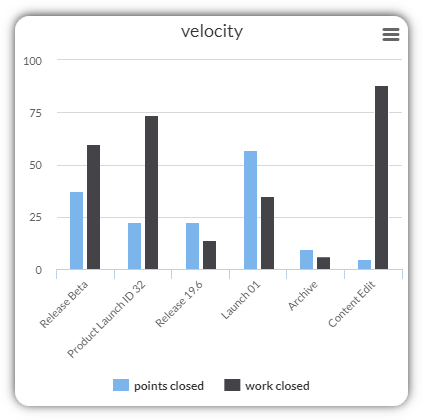
Use OneDesk to visualize the balance of your team’s effort. Track how many hours are spent on new feature innovation versus bugs and technical debt. Use this data to negotiate roadmap priorities and ensure your team isn’t drowning in maintenance.
- Visualize the split between roadmap items, support tickets, and R&D.
- Audit the total effort spent on a feature to calculate its true development cost.

Identify the Friction Before You Impact the User
OneDesk bridges the gap between your bug tickets and your development tasks. See how quickly your team resolves regressions or other issues. By linking quality metrics directly to your releases, you can identify if speed is coming at the expense of system stability.
- Measure how quickly the team squashes internal and external issues.
- Track the correlation between new feature pushes and bug ticket spikes.
- Monitor the efficiency of your internal testing and sign-off cycles.

Validate the Velocity Before You Commit the Calendar
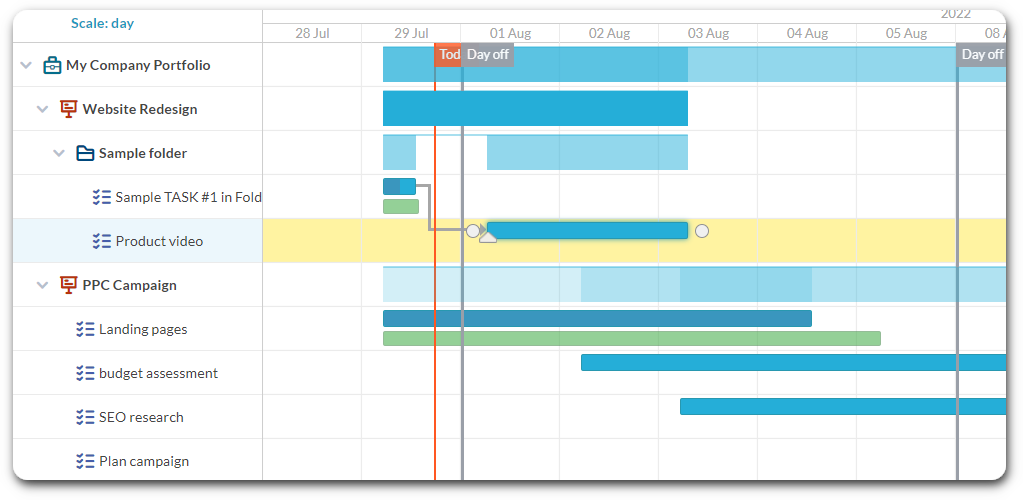
Stakeholders care about one thing: “When will it ship?” OneDesk’s Planned vs. Actual reporting allows you to compare your initial roadmap estimates against real-time velocity. By identifying drift early, you can manage stakeholder expectations with data-backed confidence rather than best-guess scenarios.
- Measure the variance between planned sprint points and actual completion.
- Visualize timeline slippage in real-time as time is logged by the team.
- Use past delivery data to improve the accuracy of future project scoping.
FEATURES
Analyze the Output Before You Approve the Outcome
Standardize your reporting, automate your insights, and ensure your product team is delivering maximum value every cycle.
FAQ
Common Questions
OneDesk allows you to categorize work by type (e.g., Feature, Bug, Debt). By using time tracking and category reports, you can show exactly what percentage of the team's capacity was dedicated to clearing the backlog versus building new features.